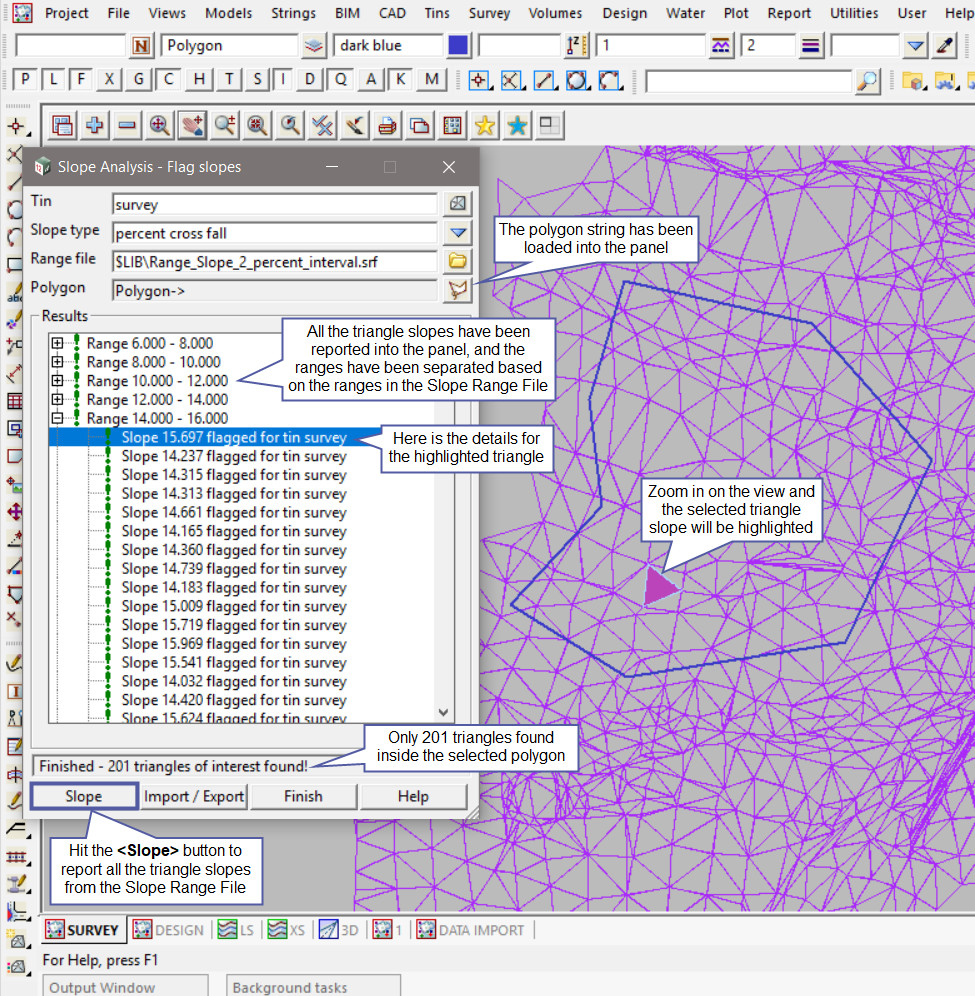
This option is used to display and report on the slope of triangles in a tin that fall within the supplied slope range file.
Continue down the page to see the Slope Analysis (Flag) Panel options.
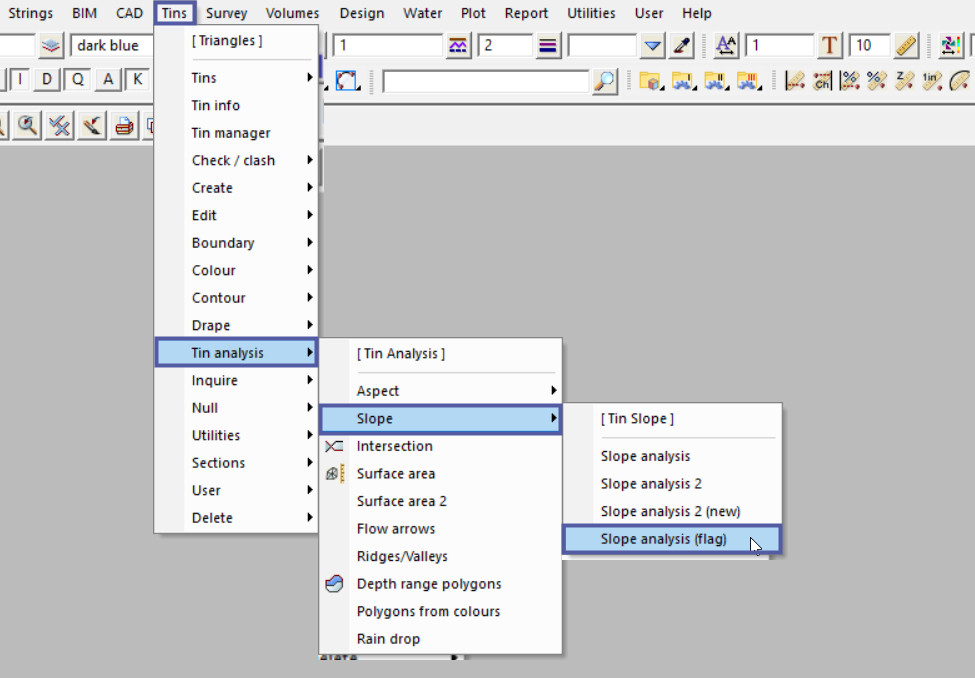
To view the Slope Analysis Flag Panel,
Use: Tins => Tin Analysis => Slope => Slope Analysis (Flag)
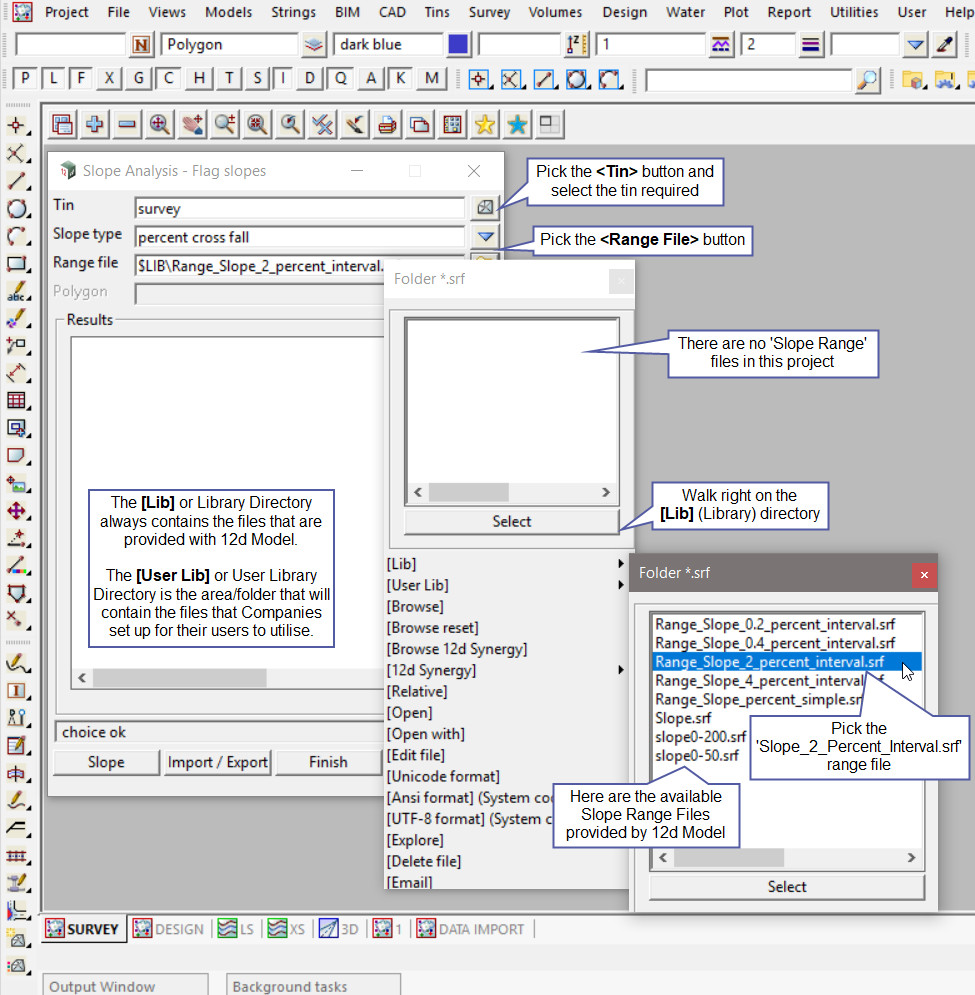
Pick the <Tin> button and select the tin required.
Pick the <Range File> button and then walk right on the [Lib] (Library) directory, and select the ‘Range_Slope_2_Percent_Interval.srf’ file.
Note: The [Lib] (Library) directory always contains the files that are provided with the 12d Model program. These files can be exactly what you are looking for and be used straight away, or a great example file that can be used to create the file required.
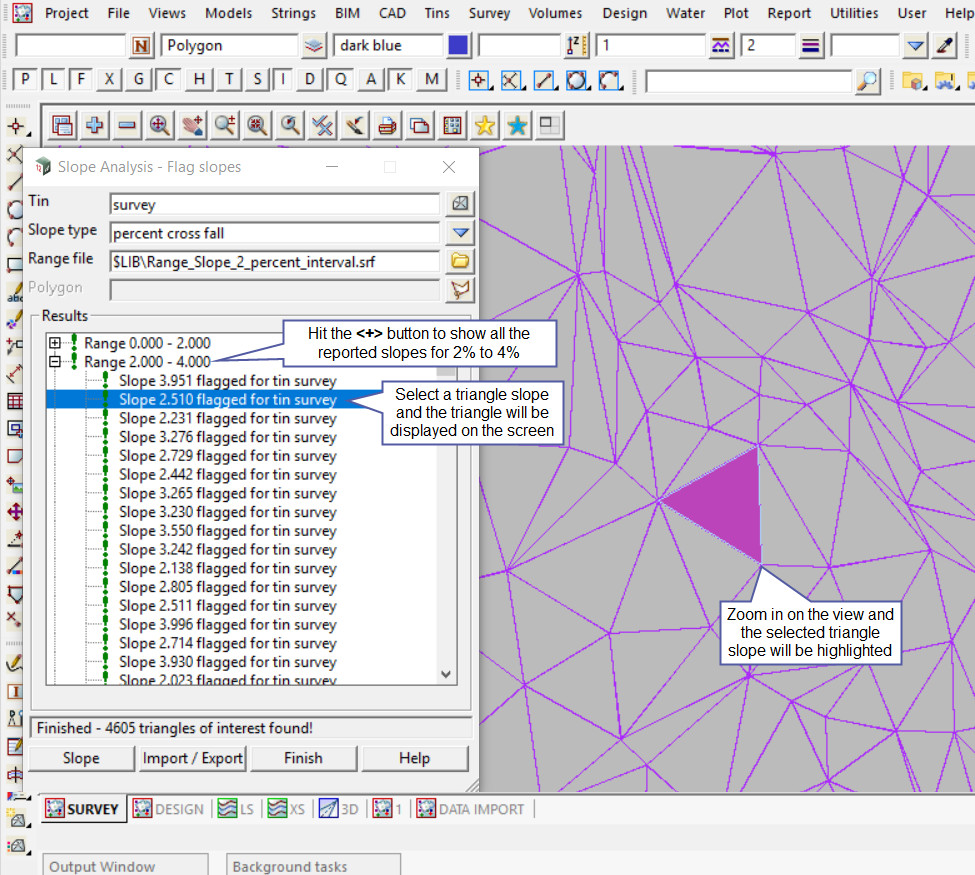
Hit the <Slope> button and the panel reports all the triangles and their slopes. The panel also separates the slope ranges into sections that are based from the slope range file.
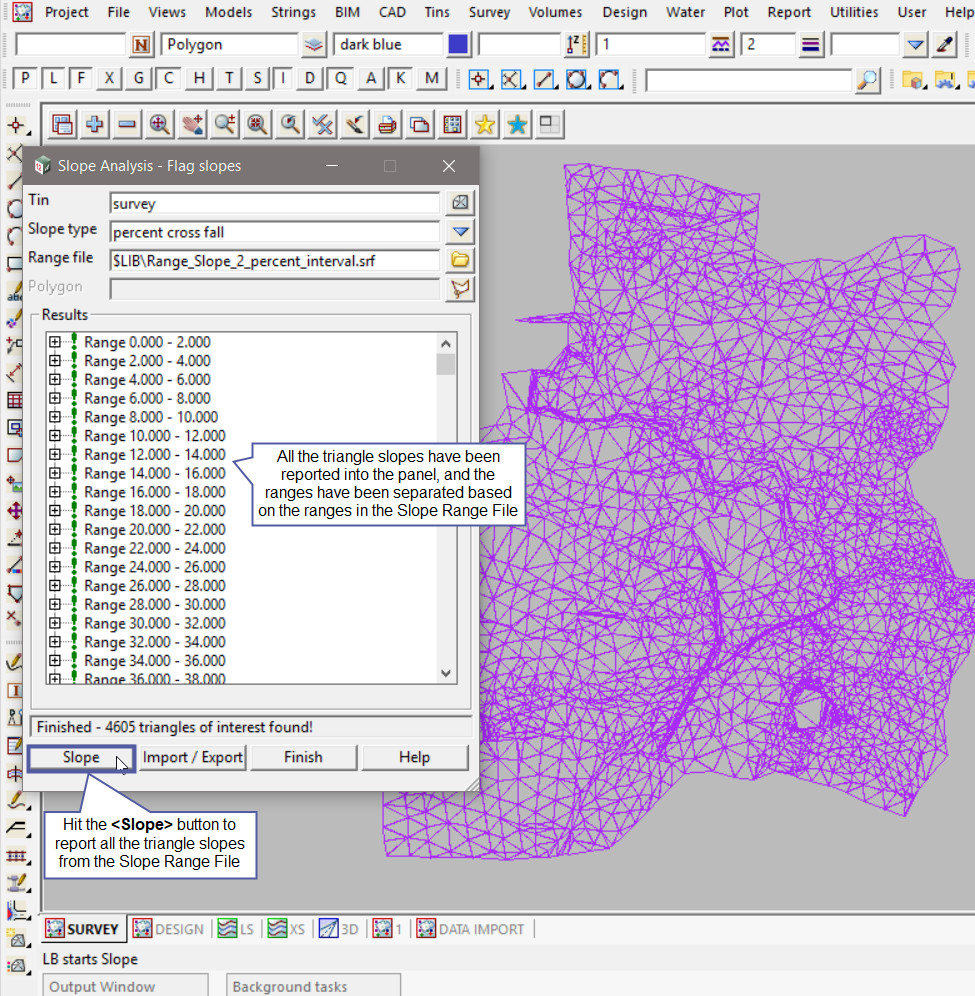
Hit the <+> button on one of the slope ranges and the list of all the triangles that fit into that slope percentage range will be listed.
Zoom in on your tin and select one of the slopes in the list and that triangle will be highlighted to indicate where the triangle is located in the tin.
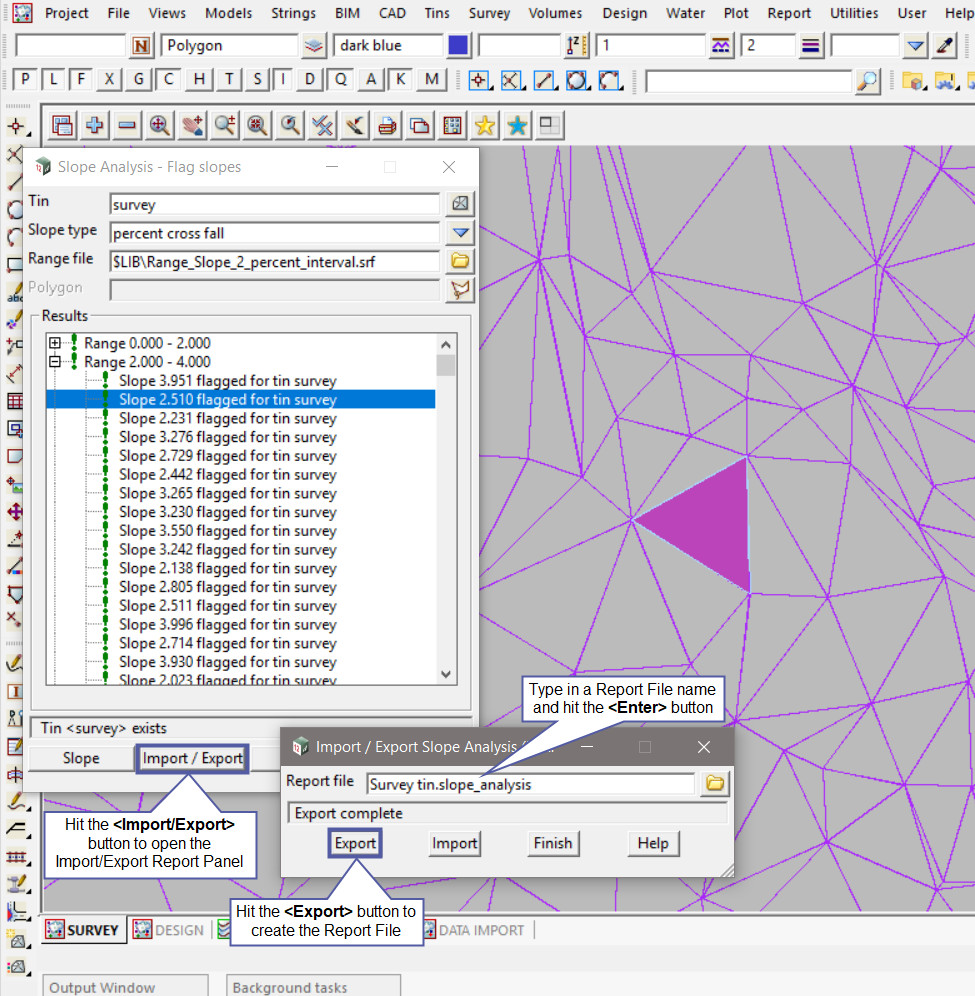
Hit the <Import/Export> button and the Import/Export Report Panel will be opened.
Type in a Report file name and hit the <Enter> button.
Hit the <Export> button to create the report file. The report file will be created in and XML format.
To report the slope analysis within a polygon, hit the <Polygon> button and pick and accept the required polygon string from the view.
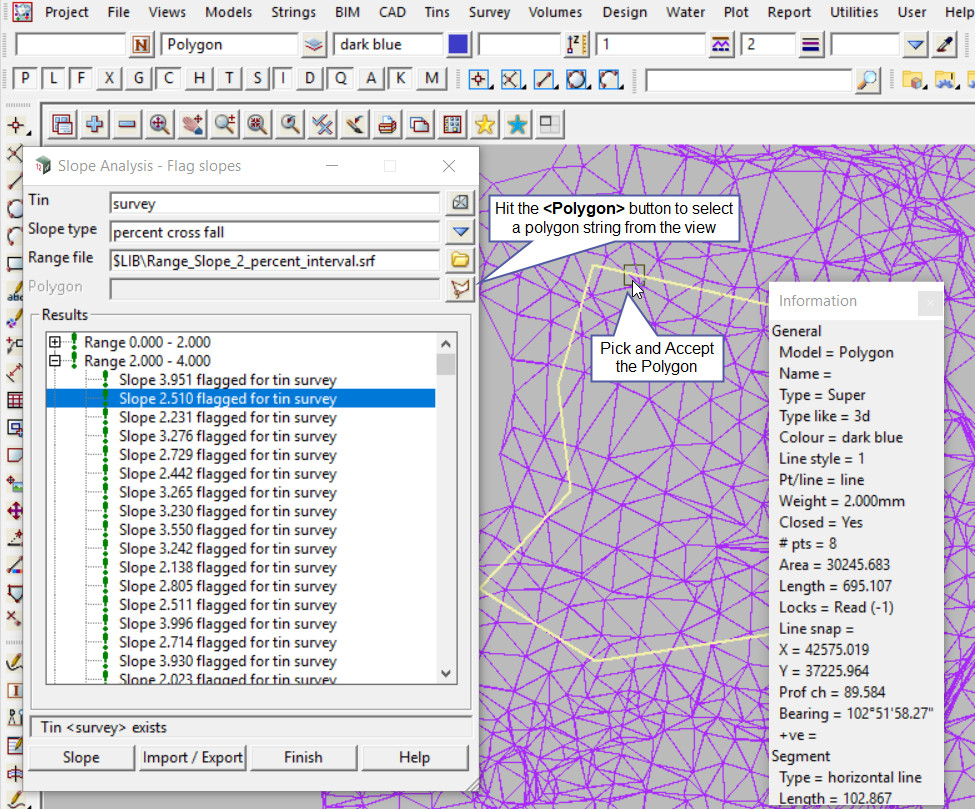
Hit the <Slope> button and the panel reports all the triangles and their slopes within the selected polygon. The panel also separates the slope ranges into sections that are based from the slope range file.
