This option is used to calculate the Slope for each triangle in a tin, and will create coloured faces in a model. This option can also create boundary strings that bound the triangles in the same slope range.
Continue down the page to see the Slope Analysis 2 Panel options.
To view the Slope Analysis 2 Panel,
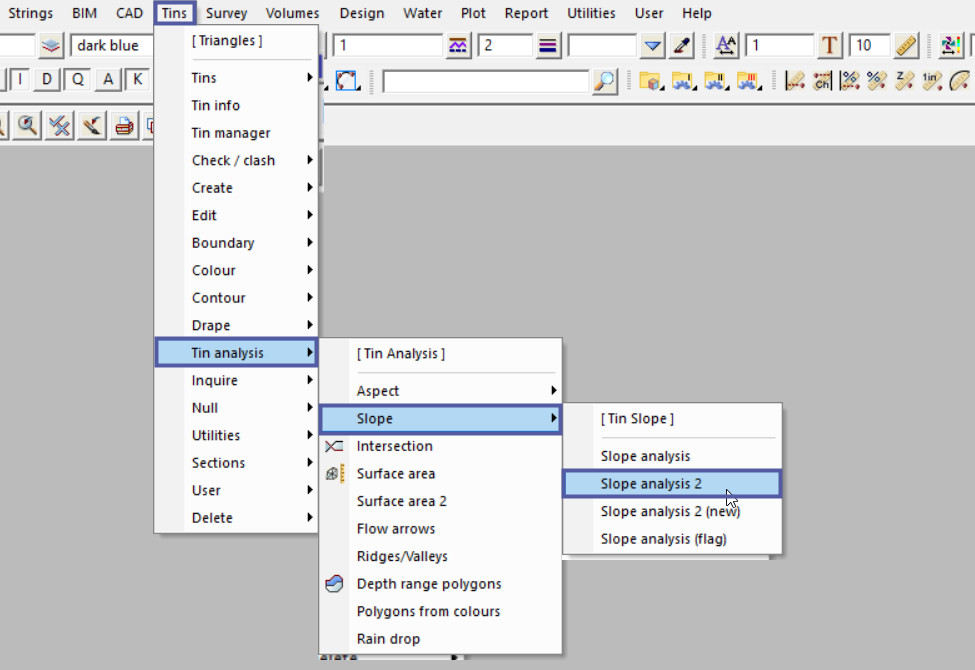
Use: Tins => Tin Analysis => Slope => Slope Analysis 2
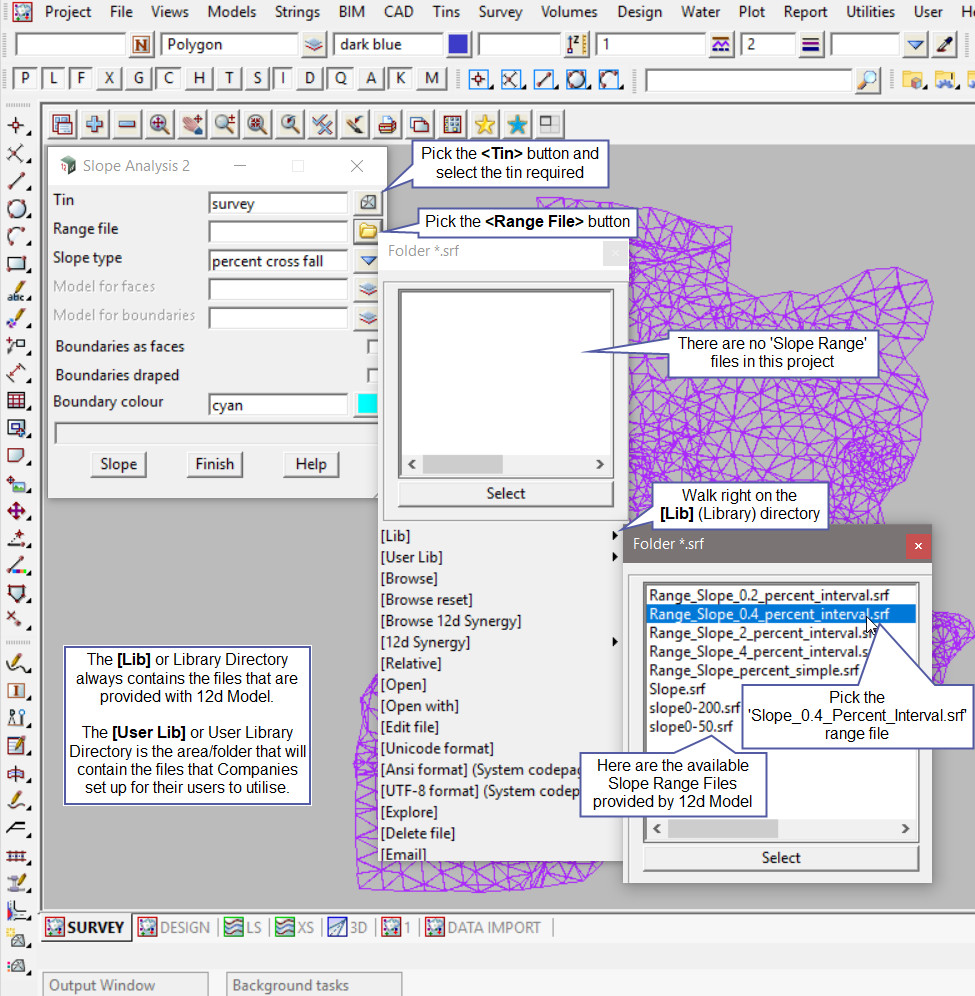
Pick the <Tin> button and select the tin required.
Pick the <Range File> button and then walk right on the [Lib] (Library) directory, and select the ‘Range_Slope_0.4_percent_interval.srf’ file.
Note: The [Lib] (Library) directory always contains the files that are provided with the 12d Model program. These files can be exactly what you are looking for and be used straight away, or a great example file that can be used to create the file required.
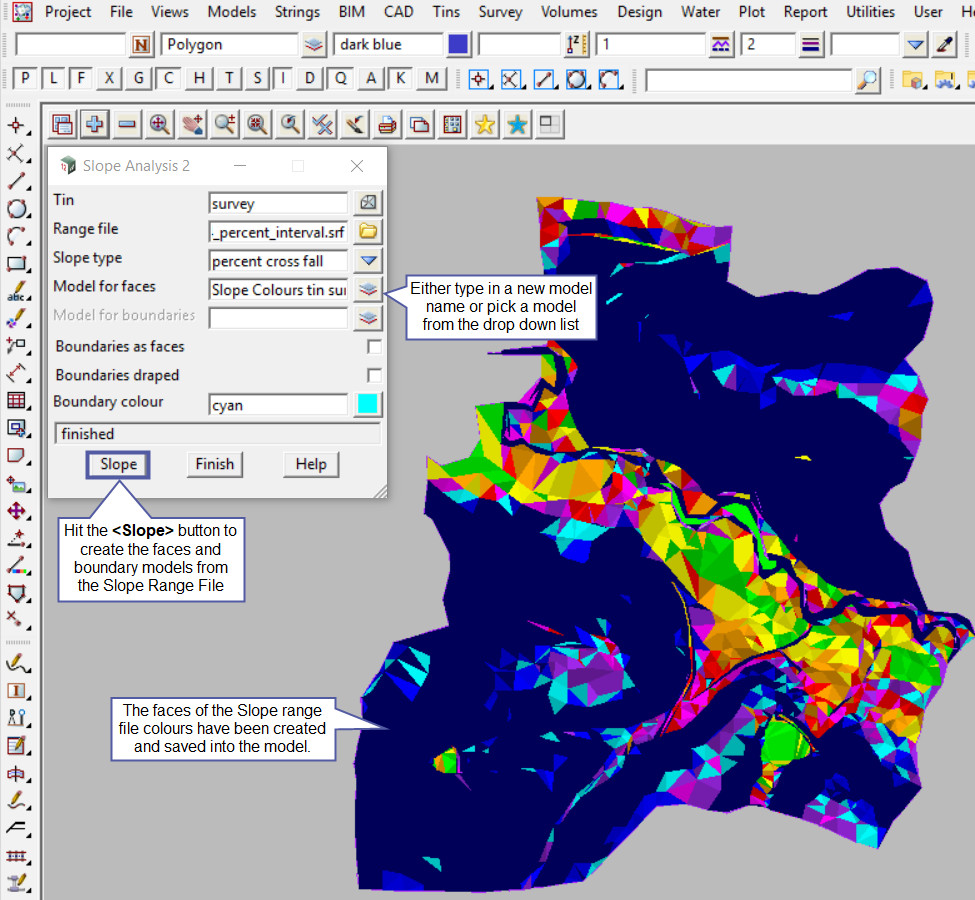
Either type in a new model name or pick the <Model> button and select a model from the drop down list for the ‘Model for faces’.
Hit the <Slope> button to create the faces in the model.
Turn on the faces model to see that the faces have been created – even check them out with the String Inquire option.
Either type in a new model name or pick the <Model> button and select a model from the drop down list for the ‘Model for boundaries’.
Hit the <Slope> button to create the boundaries in a model.
Turn off the faces model and then turn on the boundaries model to see that the boundaries around the slope faces have been created – even check them out with the String Inquire option.
The z-value for the boundary strings are taken from the line of the range file, that the boundary has been created from. In this example it is a orange 90 colour on line 13 in the range file, hence the 13.000 z-value.
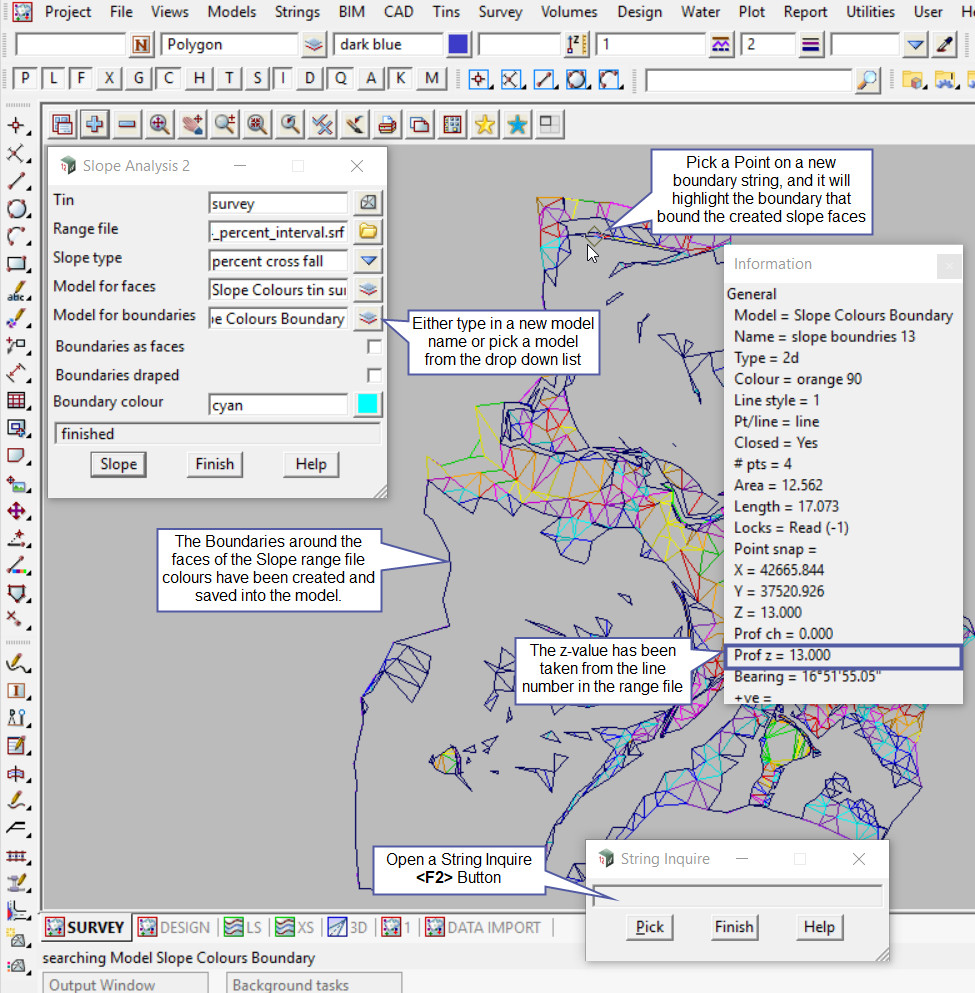
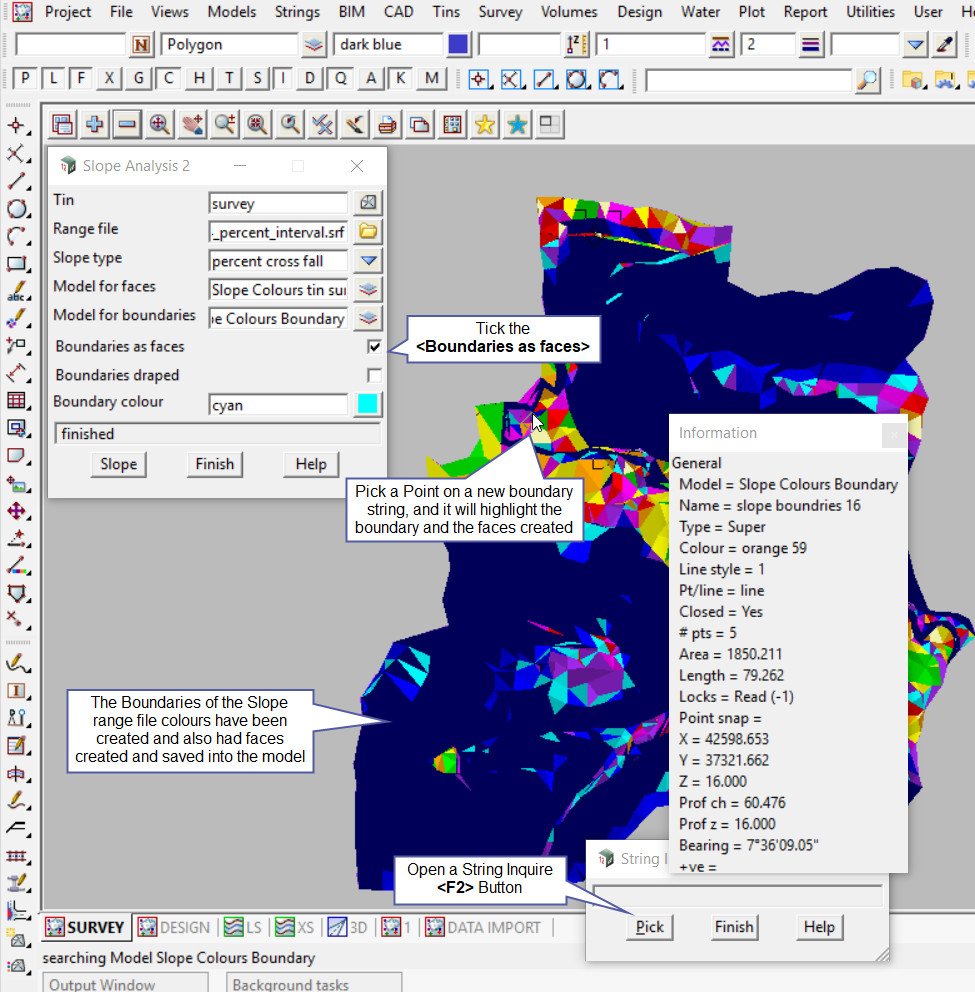
Tick the<Boundaries as Faces> option and hit the <Slope> button to re-run the panel, the boundary strings will be filled in (faces created) inside the boundary strings.
Note: Every time the panel is re-run the data is recreated, to clean the models out, use the ‘Clean Model’ option found in: Models => Clean
If you would like to learn more about the Clean Model Panel and how to utilise it,
Visit this post: Clean Model
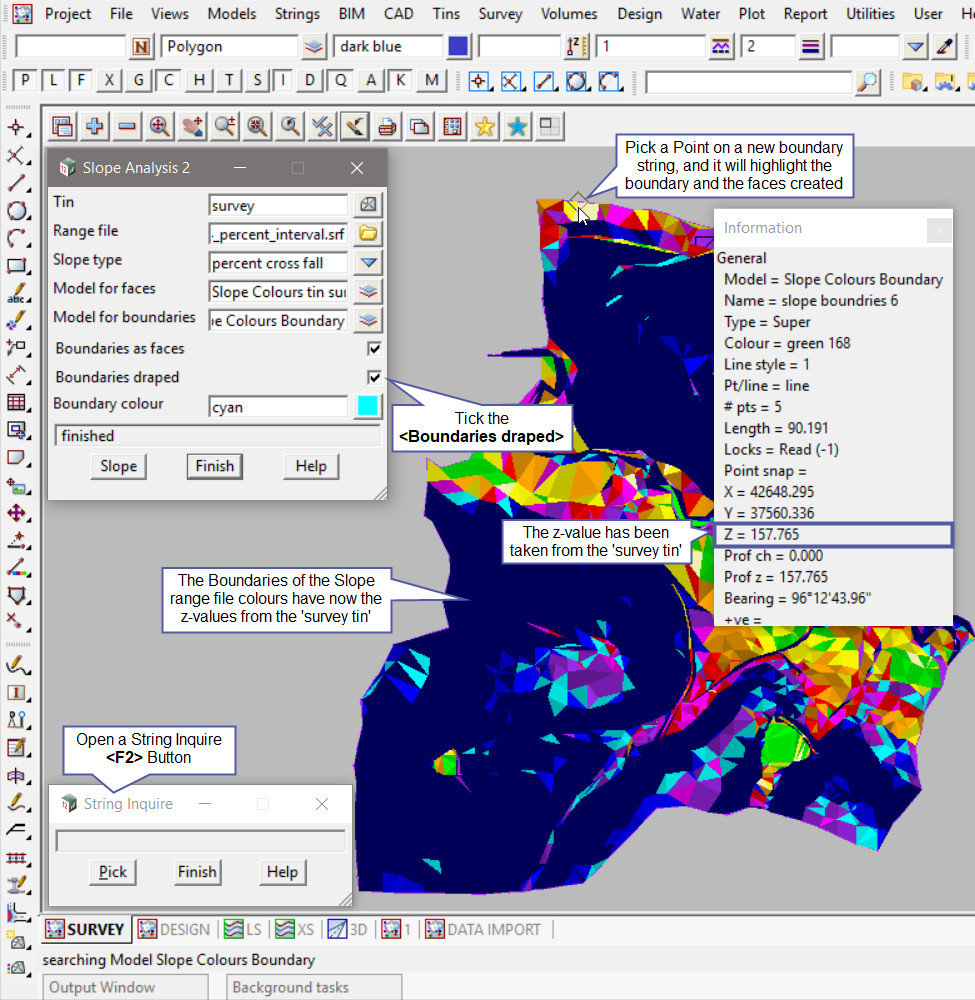
Tick the <Boundaries Draped> option and hit the <Slope> button to re-run the panel, and as shown below the boundary strings will be draped onto the tin. This option creates a lot of points, and if you only have a small points license it can be used very quickly.
Every time the panel is re-run the data is recreated, to clean the models out, use the ‘Clean Model’ option found in: Models => Clean
The ‘Boundary Colour’ option is not used for this panel, as the colour for the boundary strings are taken from the slope range file.
If you would like to differentiate between the boundary strings more than how these boundary strings are created. There is an option that will add extra text to the string names.
This can be done by using the Slope Analysis 2 New panel, if you would like to learn more about the Slope Analysis 2 New Panel and how to utilise it,
Visit this post: Slope Analysis 2 New
Slope Range File Panel Example
To open the Slope Range File to view its contents, pick the <Range File> button and then select the [Open] option from the list.
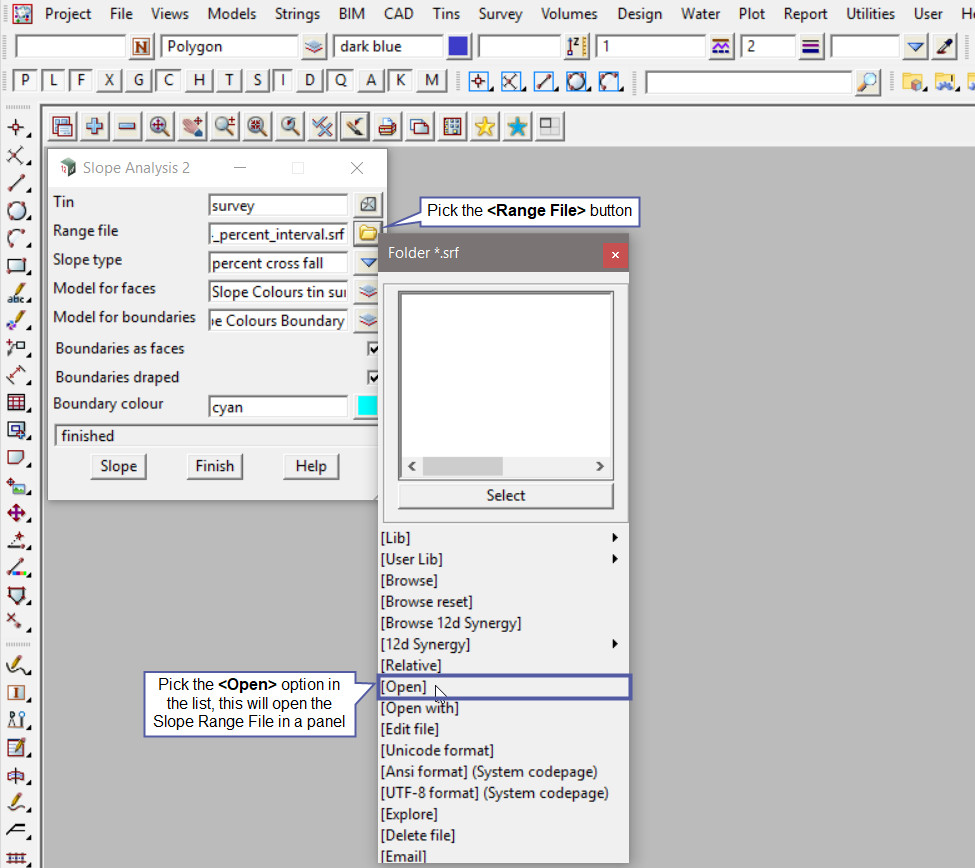
The Slope Range File panel will open and have the file shown.
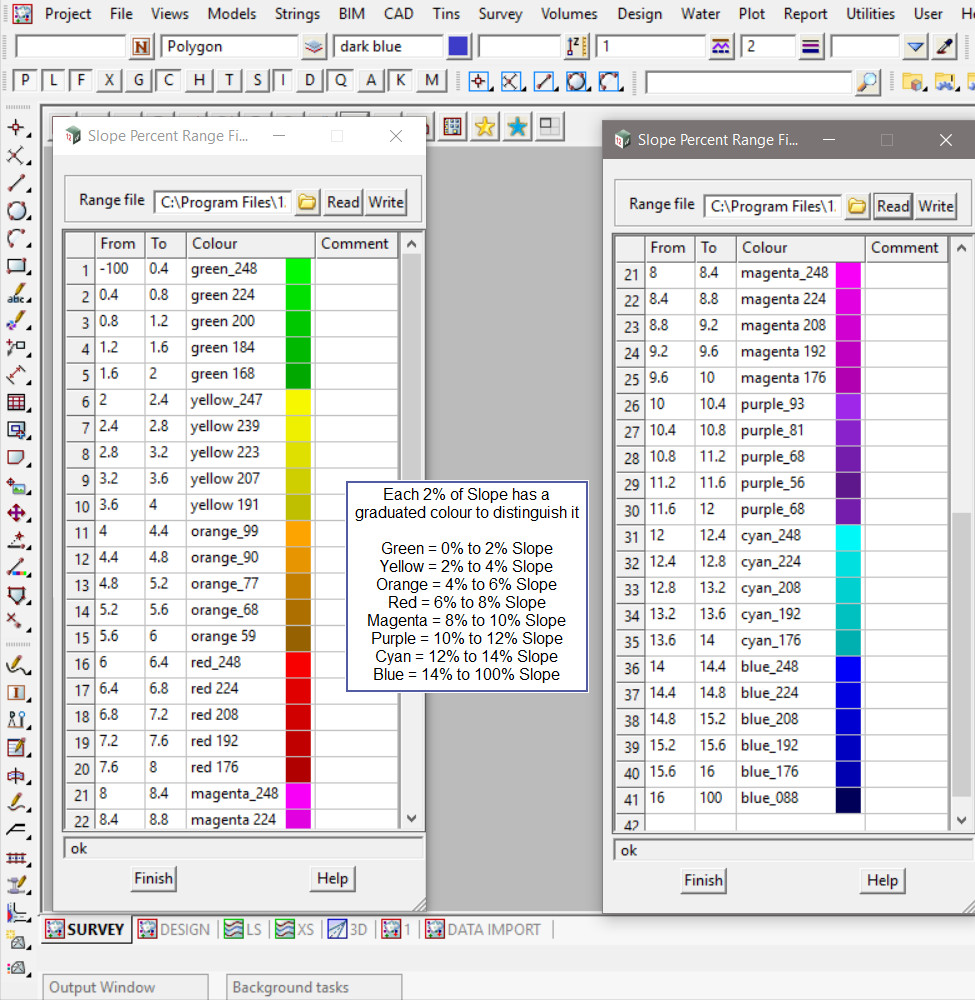
In this example there are eight different colours to differentiate between every two percent (2%) slope ranges.
If you would like to learn more about the Slope Range File Panel and how to utilise it,
Visit this post: Slope Range File
