This option is used to create a report of an existing Tin based on its slope at selected data points.
Continue down the page to see the Tin Slope Report Panel options.
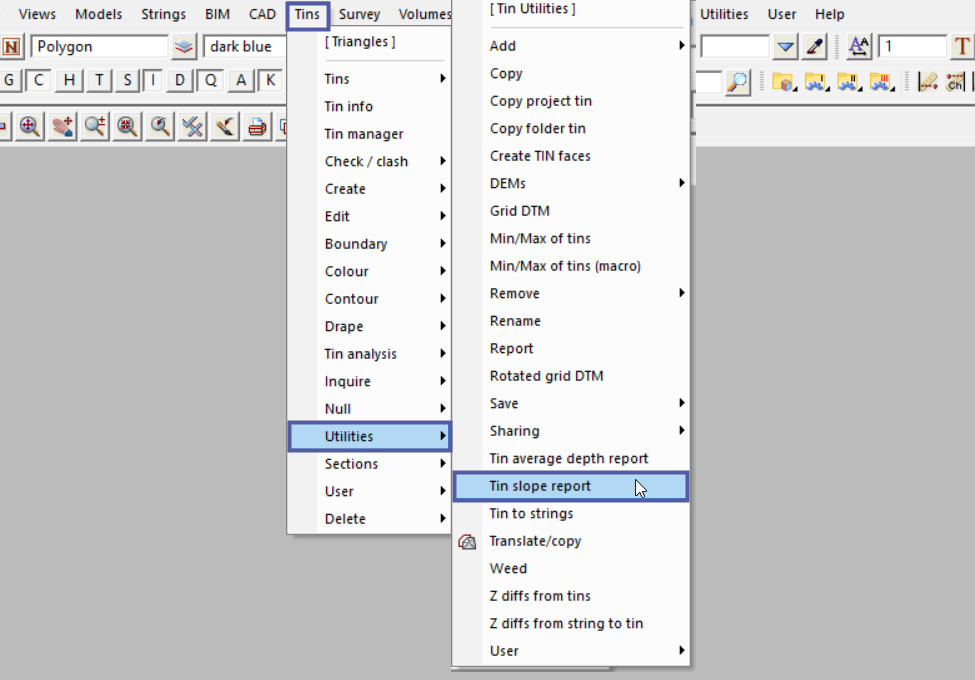
To view the Tin Slope Report Panel, Use: Tins => Utilities => Tin Slope Report

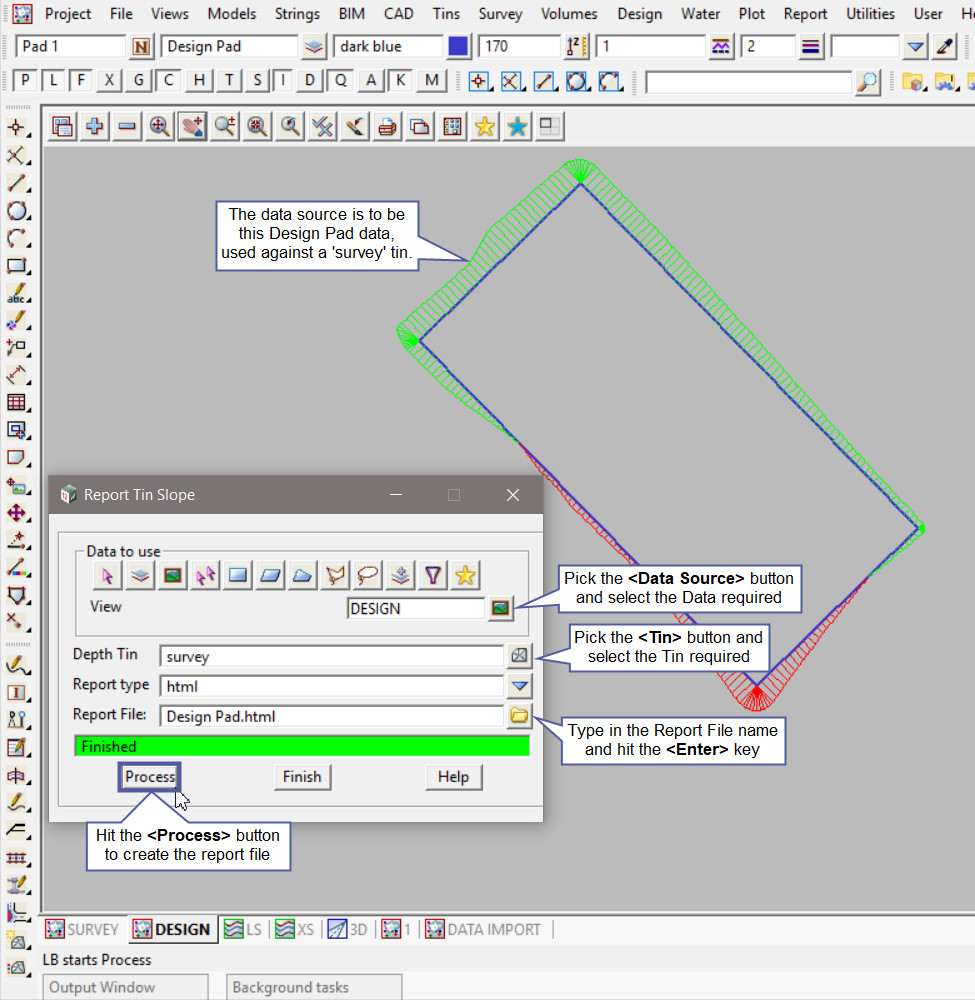
This is where the data that will be report against the tin is selected from a Data Source.
If you would like to learn more about the Data Source options and how to utilise them,
Visit this post: 12d Model Panels – Data Sources
Pick the <Tin> button and select the tin required.
The ‘Report Type’ option if set to ‘HTML’ (default), the report will be able to be viewed in an internet browser page.
Type in the ‘Report File’ name and hit the <Enter> key.
Hit the <Process> button to create the new report file.

HTML Report File Panel Example
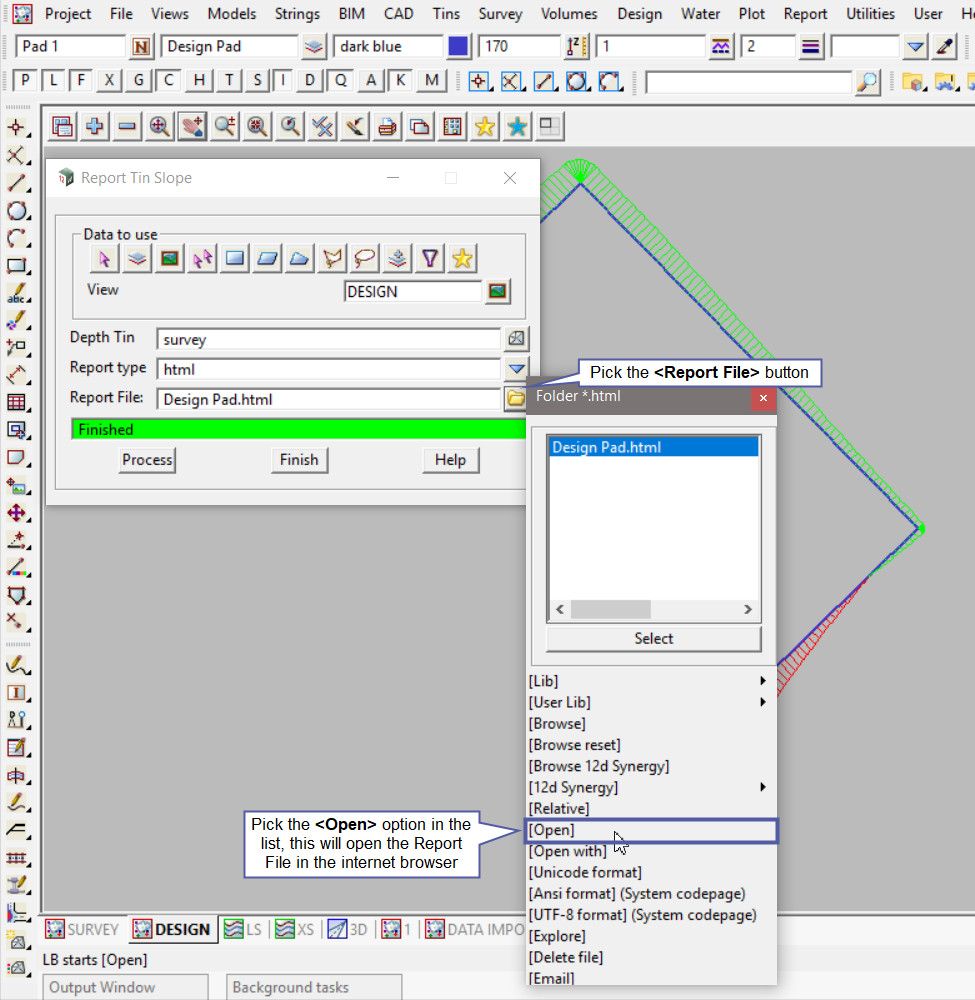
To open the HTML Report File to view its contents, pick the <Report File> button and then select the [Open] option from the list.

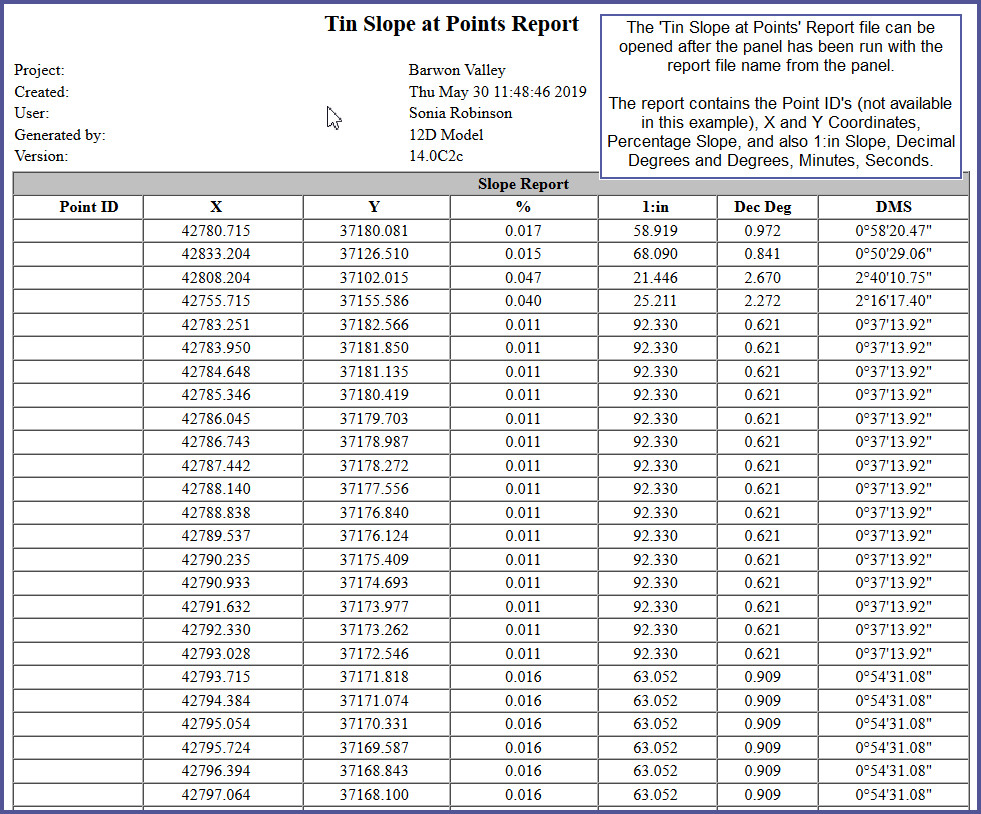
The ‘Tin Slope at Points’ Report file can be opened after the panel has been run with the report file name from the panel.
The report contains the:
- Point ID’s (not available in this example)
- X and Y Coordinates
- Percentage Slope
- 1:in Slope
- Decimal Degrees
- Degrees, Minutes,and Seconds.
