This option is an extra post on utilising the ‘Range Tab’ option on the ‘Contour, Smooth and Label’ panel.
If you would like to view the post for the Contour Smooth and Label panel and how to utilise it,
Visit this post: Contour Smooth and Label
Continue down the page to see the Contour Smooth and Label – Range Tab options.
To view the Contour, Smooth and Label Panel,
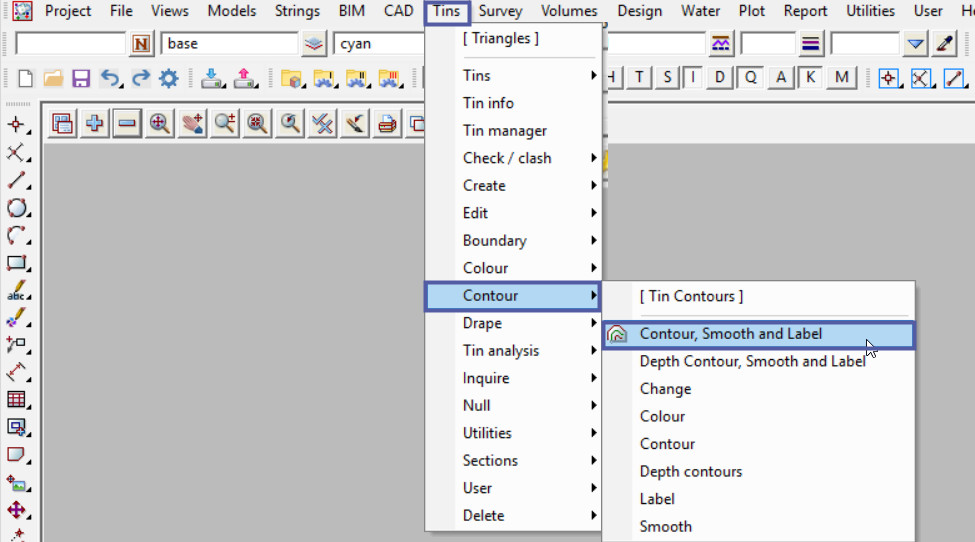
Use: Tins => Contours => Contour, Smooth and Label
Range Tab
Here if the function is not selected, pick the function from the drop down list.
Select the <Range> Tab.

Model Information Table
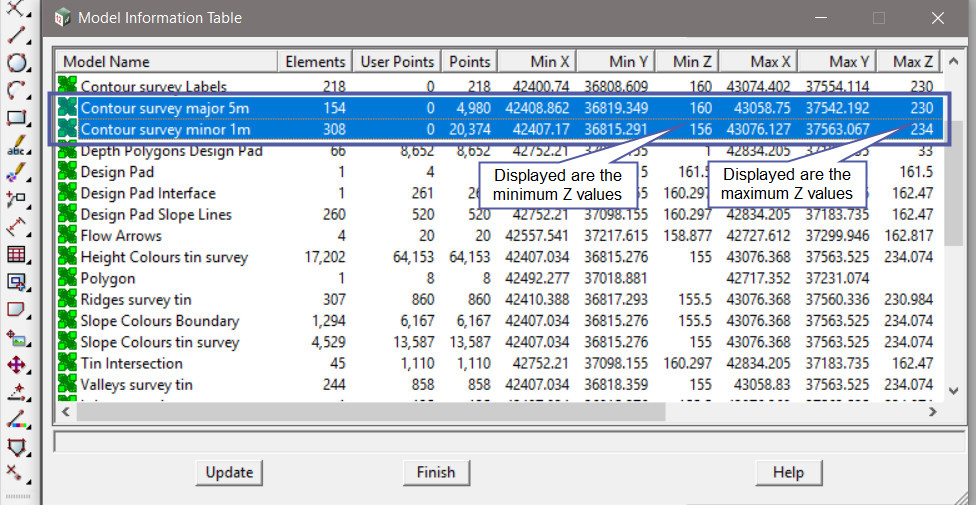
To check any information on the data, the ‘Model Information Table’ is a great way of viewing the data information in the project.
Here the minimum and maximum Z values are displayed for the contour strings.
To find the Model Information Table, use: Models => Model Info Table
If you would like to learn more about the Model Information Table Panel and how to utilise it,
Visit this post: Model Information Table
Minimum and Maximum Contour Heights
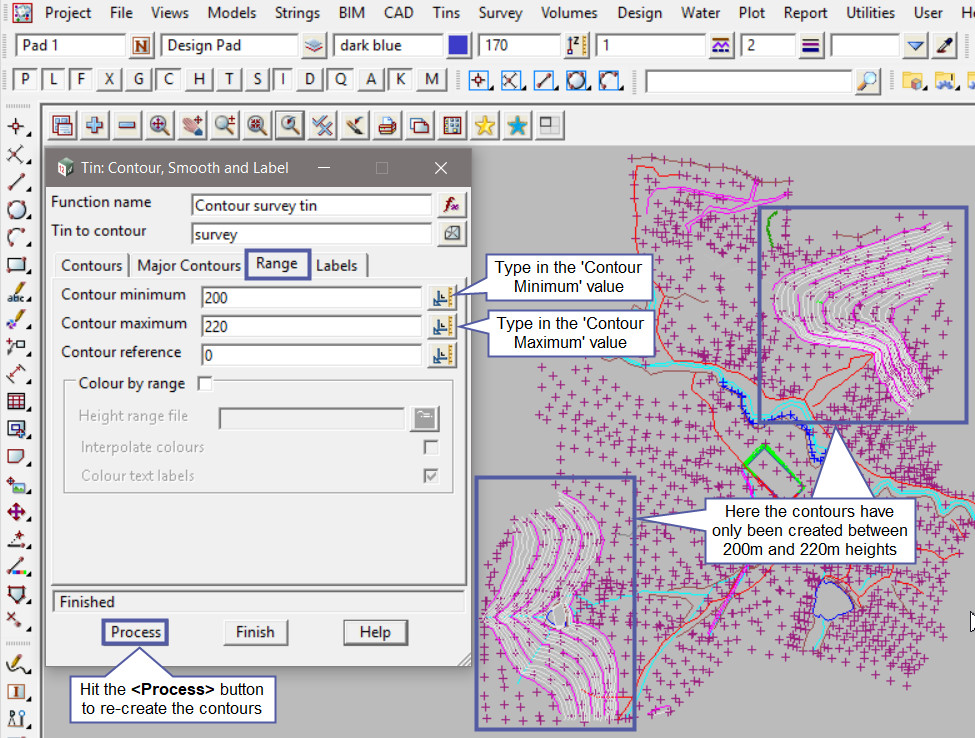
The ‘Contour Minimum’ and ‘Contour Maximum’ values are an optional feature, but when a value is entered and processed the contours can be restricted within these values.
Note: Contour strings, especially smoothed contour strings can create a lot of points and if you only require a certain area of contours, then this a way of restricting them. Also for users who only have a small points base license, this is also useful.
Hit the <Process> button to re-create the contour strings and labels.
Contour Minimum Z Value
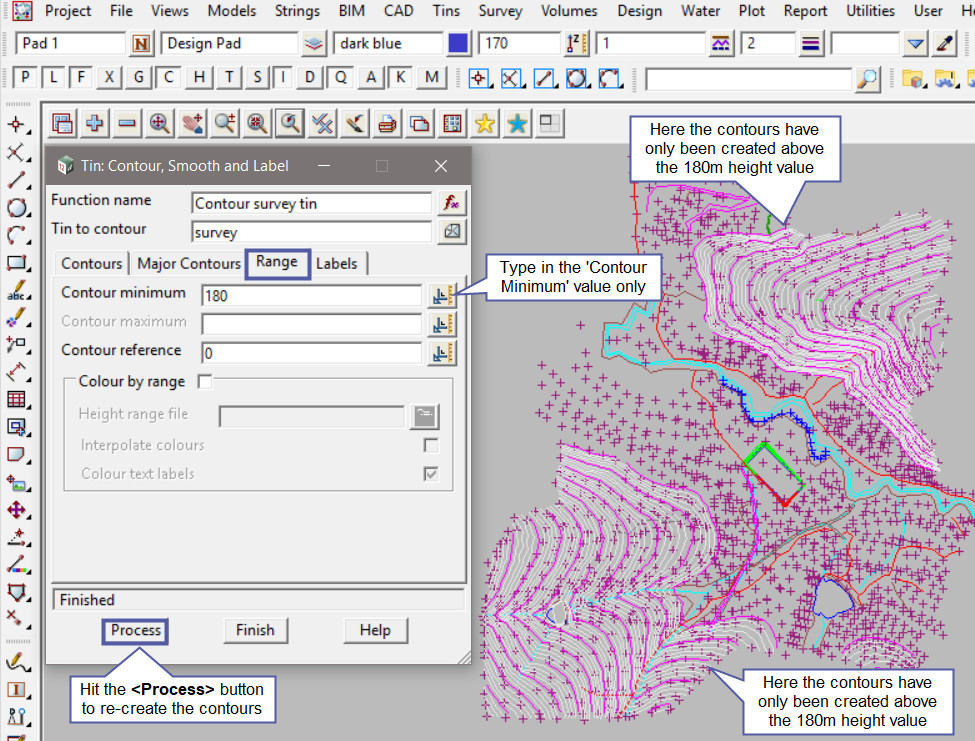
By entering a ‘Contour Minimum’ z value only the contours will only be created above this z value, as shown below.
Hit the <Process> button to re-create the contour strings and labels.
Contour Maximum Z Value
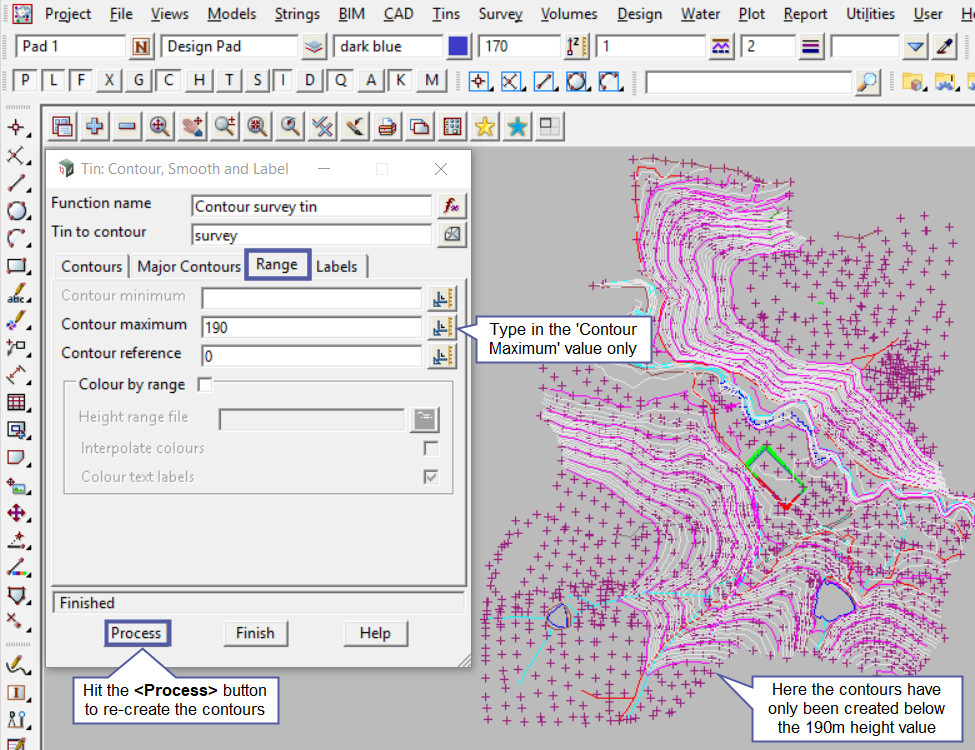
By entering a ‘Contour Maximum’ z value only the contours will only be created below this z value, as shown below.
Hit the <Process> button to re-create the contour strings and labels.
Colour By Range
Pick the <Height Range File> button and then walk right on the [Lib] (Library) directory, and select the ‘Range_Height_at_1m_Interval.hrf’ file.
Note: The [Lib] (Library) directory always contains the files that are provided with the 12d Model program. These files can be exactly what you are looking for and be used straight away, or a great example file that can be used to create the file required.
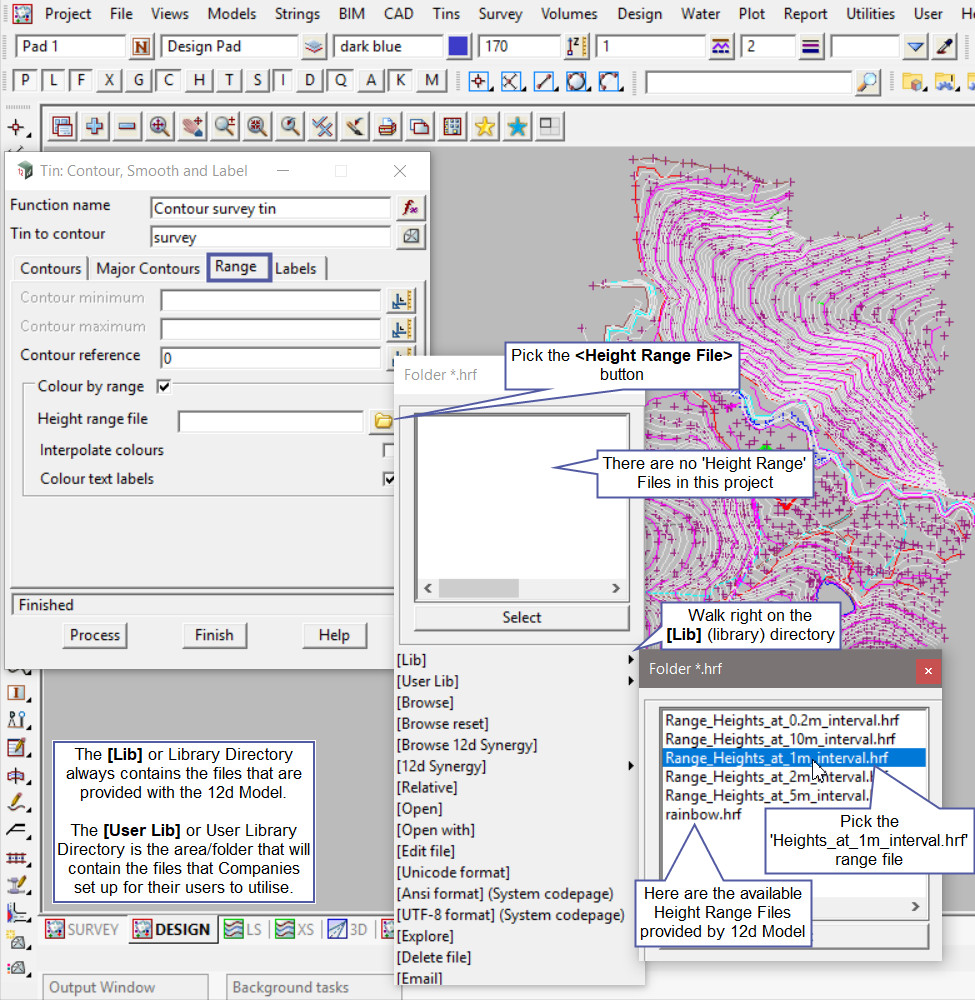
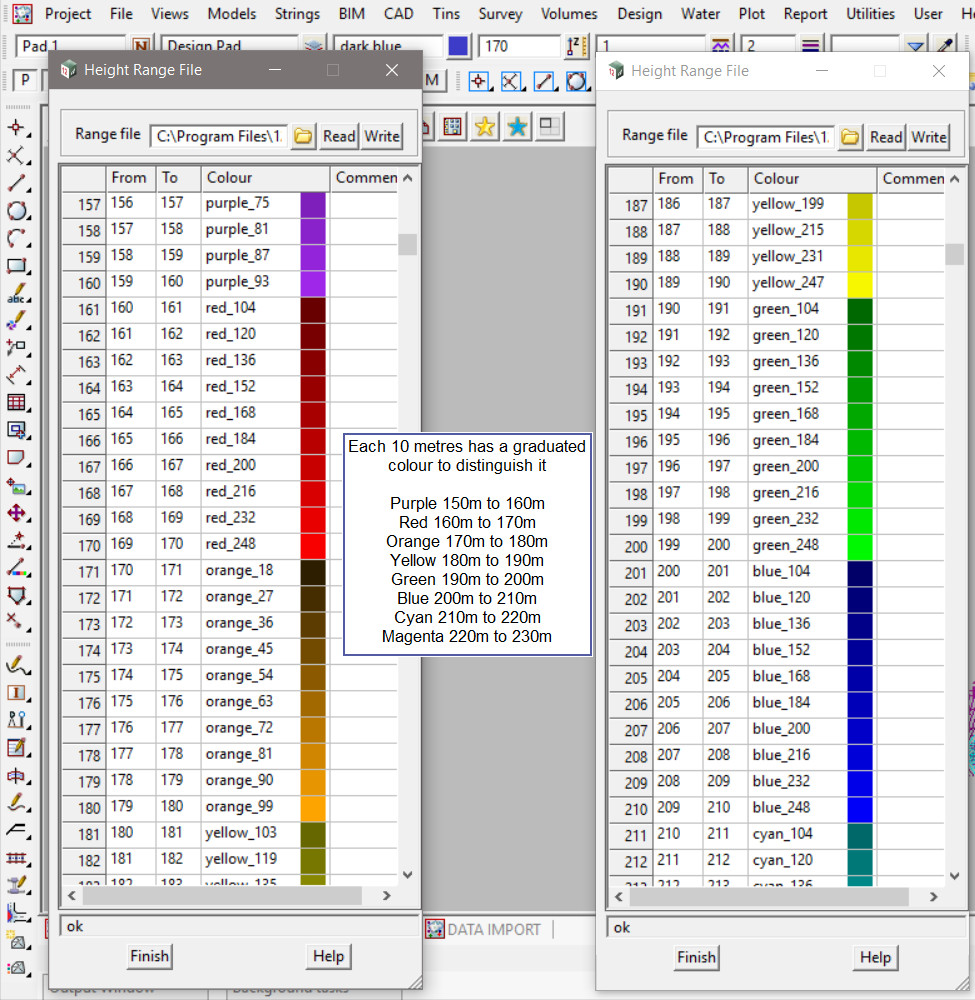
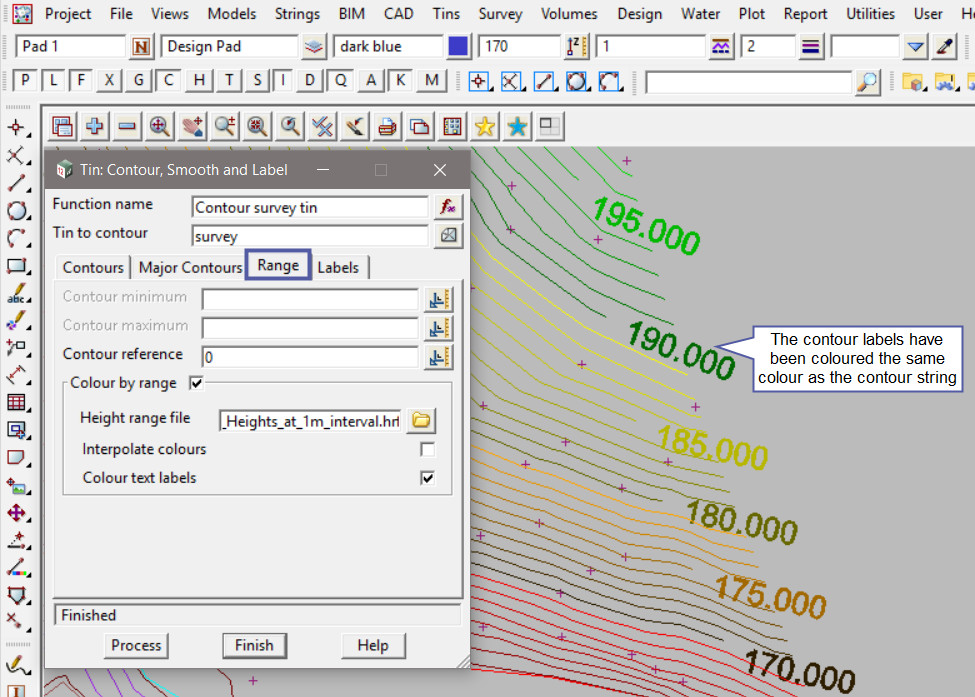
Hit the <Process> button and see that the Height range bands will colour the contour strings. Each different colour displayed is a graduated colour range for every 10 metres of height. The colours are listed in the height range file.
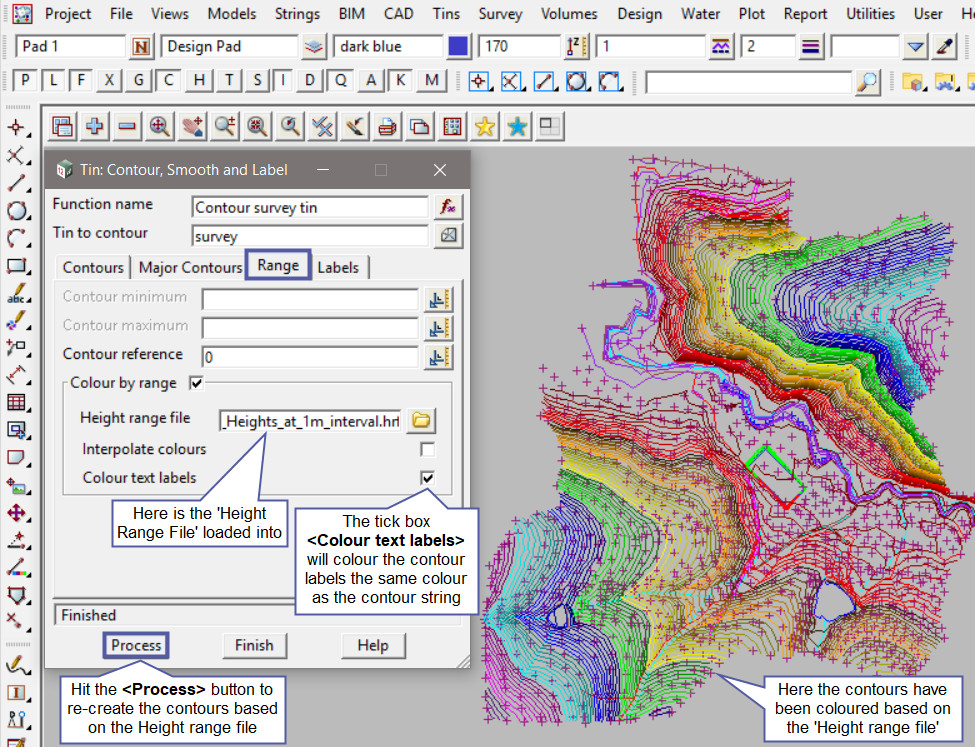
The Contour labels have been coloured the same colour as the contour strings.
Height Range File Panel Example
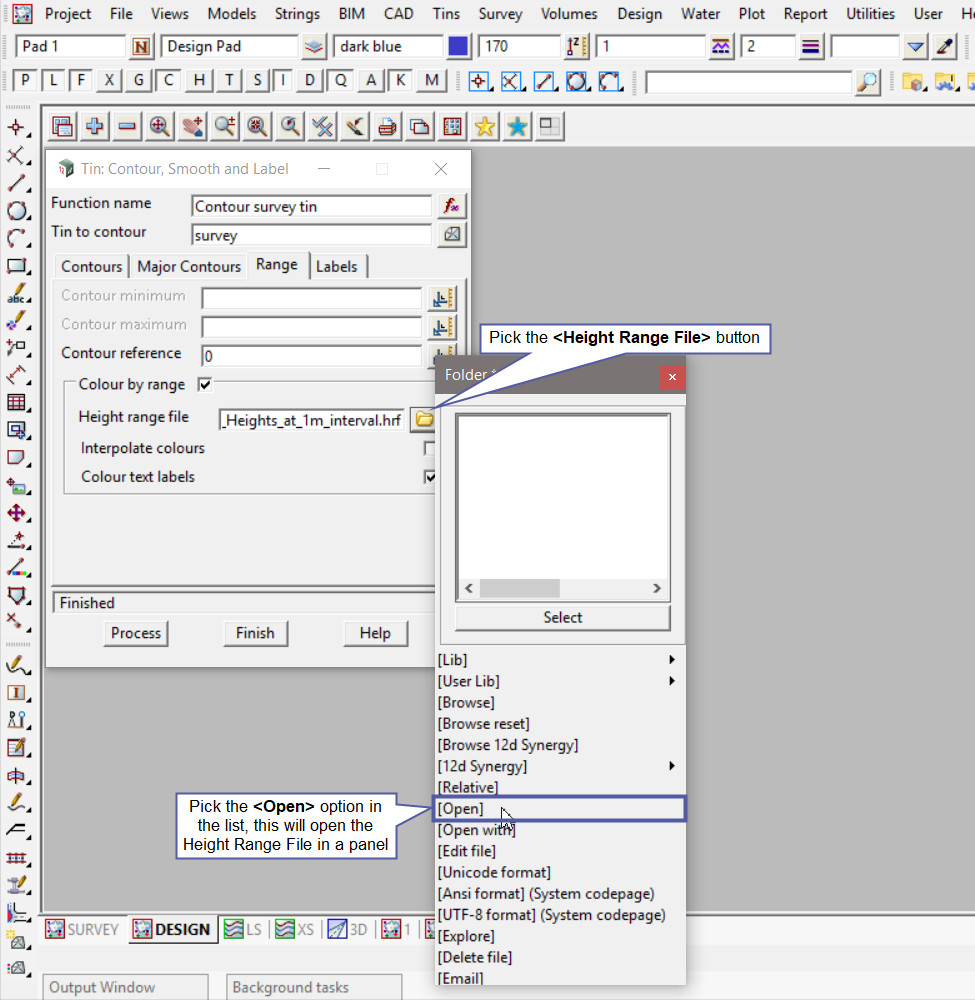
To open the Height Range File to view its contents, pick the <Height Range File> button and then select the [Open] option from the list.
The Height Range File panel will open and have the file shown.
In this height range file example the heights go from zero (sea level) to 2240 metres (Mount Kosciusko), so it will cover all areas of Australia. The different colour graduations are to differentiate between every 10 metres.
If you would like to learn more about the Height Range File Panel and how to utilise it,
Visit this post: Height Range File
